MPAndroidChat的PieChart和BarChart学习_mpandroidchar 动画-程序员宅基地
技术标签: android应用开发
先把要写的写下来,有时间再详写
之前学MPAndroidChat主要看了这个人的博文http://blog.csdn.net/shineflowers/article/details/44809119,但是发现和github上的内容有出入,仔细研究了后发现github上的代码原来一直在更新,博主只是因为版本低所以不一样,所以我从github上导出工程后再导出jar包就是最新的了。
下面的中文说明http://www.jianshu.com/p/c049389d348a?nomobile=yes
---------------------------------------------------------------------------------------------------------------------------------------------------
今天算是有时间了 ,抽点时间把图表内容总结一下,有部分是copy上述引用博文的,有部分是自己总结的,代码如下:
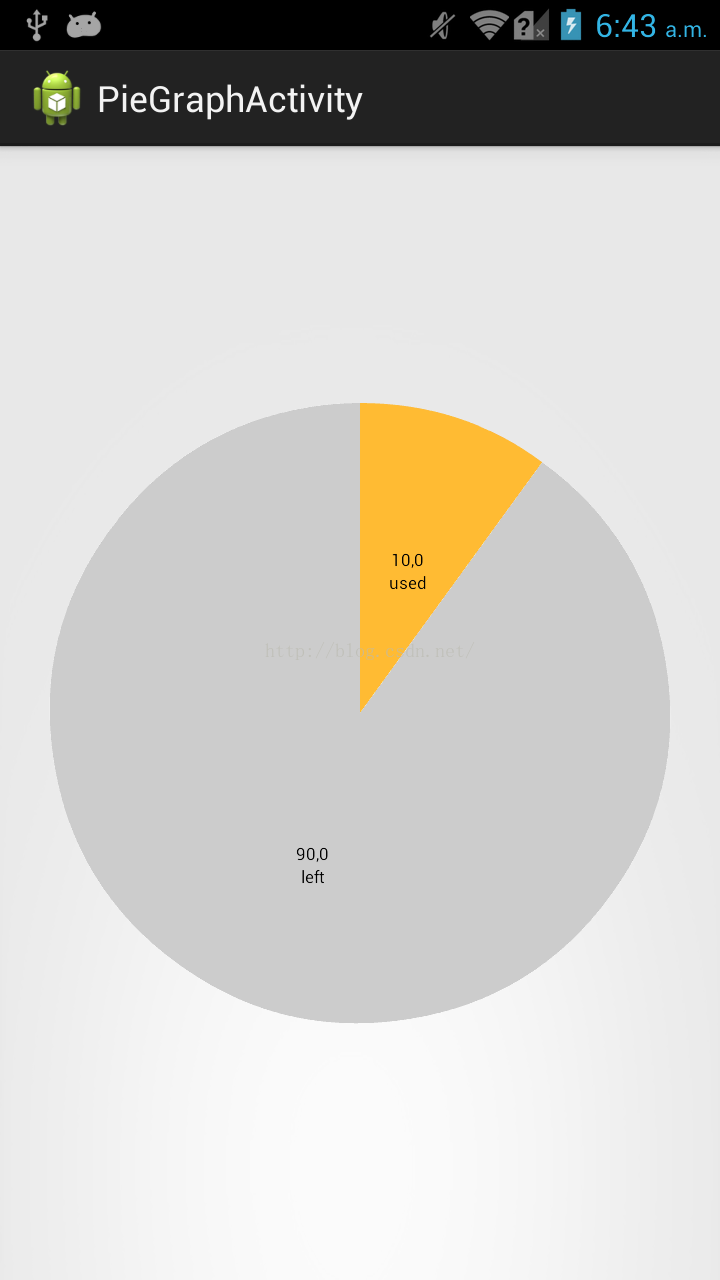
饼型图:
package myapp.charttest;

import java.util.ArrayList;

import android.app.Activity;
import android.graphics.Color;
import android.os.Bundle;

import com.github.mikephil.charting.charts.PieChart;
import com.github.mikephil.charting.components.Legend;
import com.github.mikephil.charting.data.Entry;
import com.github.mikephil.charting.data.PieData;
import com.github.mikephil.charting.data.PieDataSet;

public class PieGraphActivity extends Activity {
    PieChart pieChart;

	@Override
	protected void onCreate(Bundle savedInstanceState) {
		super.onCreate(savedInstanceState);
		setContentView(R.layout.activity_pie_graph);
		init();
		setChart();
	}

	public void init(){
		pieChart=(PieChart)findViewById(R.id.pie_chart);
	}

	public void setChart(){

		//名字
		ArrayList<String> names=new ArrayList<String>();
		names.add("used");
		names.add("left");
		//大小
		ArrayList<Entry> sizes=new ArrayList<Entry>();
		sizes.add(new Entry(10,0));
		sizes.add(new Entry(90,1));
		//颜色
		ArrayList<Integer> colors=new ArrayList<Integer>();
        colors.add(Color.parseColor("#FFBB33"));
        colors.add(Color.parseColor("#CCCCCC"));

		PieDataSet pieDataSet=new PieDataSet(sizes,"");//参数:颜色栏显示颜色目录、
		//pieDataSet.setDrawValues(false);//是否在块上面显示值以及百分百
		//pieDataSet.setSliceSpace(0f);//块间距
		pieDataSet.setColors(colors);


		//DisplayMetrics metrics=this.getResources().getDisplayMetrics();
		PieData pieData=new PieData(names,pieDataSet);


		pieChart.setTransparentCircleRadius(0f);//设置大圆里面透明小圆半径,和洞不是一个圆

		pieChart.setDrawHoleEnabled(true);
		//pieChart.setHoleColorTransparent(true);//设置中心洞是否透明:true为黑,false为白
		pieChart.setHoleRadius(0f);//设置大圆里面的无色圆的半径(洞...)


		pieChart.setDescription("");//参数:右下角显示图形描述

		pieChart.setDrawCenterText(false);//不显示图中心文字
		pieChart.setCenterText("traffic graph");//图中心文字
		pieChart.setRotationEnabled(false);//不能手动旋转

		//pieChart.setDrawMarkerViews(false);
		//pieChart.setDrawSliceText(false);//块的文本是否显示


		pieChart.setData(pieData);

		Legend legend=pieChart.getLegend();
		legend.setEnabled(false);//是否显示图形说明,必须要放在setData后,否则出错

		//两个参数有不同的意思:
		//durationMillisX:每个块运行到固定初始位置的时间
		//durationMillisY: 每个块到绘制结束时间
		pieChart.animateXY(1000, 1000);//设置动画(参数为时间)

	}


}
显示结果:
直方图:
package myapp.charttest;

import java.util.ArrayList;

import android.app.Activity;
import android.graphics.Color;
import android.os.Bundle;
import android.view.WindowManager;

import com.github.mikephil.charting.charts.BarChart;
import com.github.mikephil.charting.components.Legend;
import com.github.mikephil.charting.components.XAxis;
import com.github.mikephil.charting.components.XAxis.XAxisPosition;
import com.github.mikephil.charting.components.YAxis;
import com.github.mikephil.charting.components.YAxis.YAxisLabelPosition;
import com.github.mikephil.charting.data.BarData;
import com.github.mikephil.charting.data.BarDataSet;
import com.github.mikephil.charting.data.BarEntry;

public class RecGraphActivity extends Activity {
	BarChart barChart;

	@Override
	protected void onCreate(Bundle savedInstanceState) {
		super.onCreate(savedInstanceState);

		getWindow().setFlags(WindowManager.LayoutParams.FLAG_FULLSCREEN,
                WindowManager.LayoutParams.FLAG_FULLSCREEN);

		setContentView(R.layout.activity_rec_graph);
		init();
		setData();
	}

	public void init(){
		barChart=(BarChart)findViewById(R.id.bar_chart);
	}

	public void setData(){
		//名称
		ArrayList<String> names=new ArrayList<String>();
		names.add("1月1日");
		names.add("1月2日");
		names.add("1月3日");
		names.add("1月4日");
		names.add("1月5日");
		names.add("1月6日");
		names.add("1月7日");
		names.add("1月8日");
		names.add("1月9日");
		//大小(高低)
		ArrayList<BarEntry> sizes=new ArrayList<BarEntry>();
		sizes.add(new BarEntry(80,0));
		sizes.add(new BarEntry(70,1));
		sizes.add(new BarEntry(60,2));
		sizes.add(new BarEntry(50,3));
		sizes.add(new BarEntry(40,4));
		sizes.add(new BarEntry(30,5));
		sizes.add(new BarEntry(20,6));
		sizes.add(new BarEntry(10,7));
		sizes.add(new BarEntry(0,8));

		//颜色
		BarDataSet barDataSet=new BarDataSet(sizes,"");
		barDataSet.setColor(Color.parseColor("#FFBB33"));

		BarData barData=new BarData(names,barDataSet);

		barChart.setDescription("");//数据描述
		barChart.setNoDataTextDescription("No Data");//没有数据时显示

		//barChart.setDragEnabled(false);//拖拽(蛋疼)

		barChart.setScaleEnabled(true);//手动缩放效果
		barChart.setPinchZoom(false);//xy轴同时缩放,和setScaleEnabled一起使用

		barChart.setHighlightPerTapEnabled(true);//按下时高亮显示

		//barChart.setDrawGridBackground(false);
		//barChart.setDrawBorders(false);//画布边框

		//barChart.setVisibleXRange(7);
		//barChart.setMaxVisibleValueCount(6);
		barChart.setDrawBarShadow(false);//设置矩形阴影不显示
		barChart.setBackgroundColor(Color.parseColor("#FFFFFF"));//设置背景颜色

		barChart.setMinOffset(0);//=padding
		barChart.setDrawValueAboveBar(true);

		barChart.setData(barData);
		barChart.animateXY(1000, 1000);//设置动画

		Legend legend=barChart.getLegend();//取消图形说明
		legend.setEnabled(false);

		//获取X轴坐标
		XAxis xAxis=barChart.getXAxis();
		xAxis.setPosition(XAxisPosition.BOTTOM);//X坐标位于图标底部
		xAxis.setDrawGridLines(false);
		xAxis.setSpaceBetweenLabels(2);//设置名字names之间的间距
		//xAxis.

		//获取Y轴右坐标
		YAxis yAxisR=barChart.getAxisRight();
		yAxisR.setEnabled(false);
		yAxisR.setDrawGridLines(false);

		//获取Y轴左坐标
		YAxis yAxisL=barChart.getAxisLeft();
		yAxisL.setEnabled(false);
		yAxisL.setDrawGridLines(false);
	}
}
显示结果:
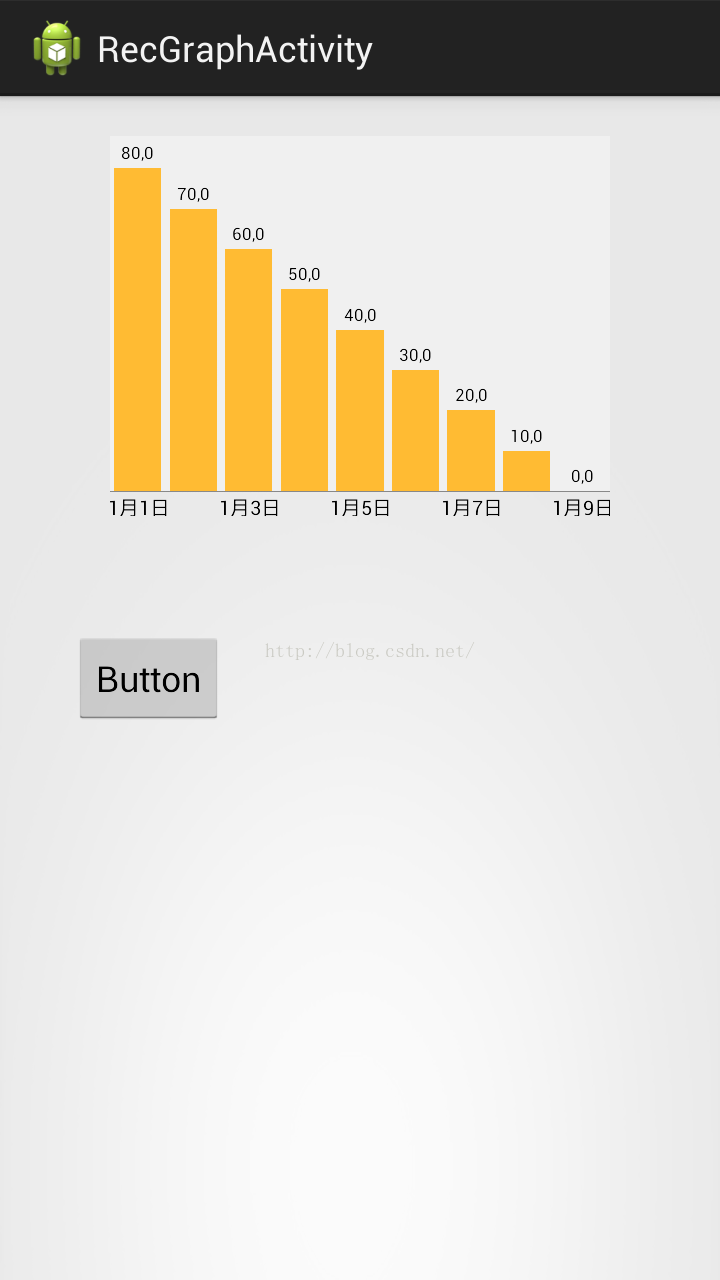
遇到的相关问题:
1:barChart的横坐标值没有显示。原因:视图中图表控件高度是match_parent,需要增加属性android:layout_marginBottom="35dp"(或者其他值)
--------------------------------------------------------------------------------------------------------------------------------------------------
大叫好,今天又有时间写博文了,之前上传了图片没看,今天一瞧真TM大,尴尬了......
嗯,继续解决上述第二个问题,今天看了一天的源代码,是在没有找到能够初始化柱子的函数,悲剧,所以只能从其他方法入手,我的想法是让柱子的总数一定,比如30天,有30个数据,但是我要它只显示7个数据,我们可以让直方图放大四倍,这样显示在屏幕上的就是7个数据了,好了有了目标就可以动手了
首先我们发现直方图自己就有缩放功能,于是我们看看能不能修改源代码,自己新增一下借口和改一下源代码:
这段代码是在BarLineChartTouchListener类中,处理触摸事件
public boolean onTouch(View v, MotionEvent event) {

        if (mVelocityTracker == null) {
            mVelocityTracker = VelocityTracker.obtain();
        }
        mVelocityTracker.addMovement(event);

        if (event.getActionMasked() == MotionEvent.ACTION_CANCEL) {
            if (mVelocityTracker != null) {
                mVelocityTracker.recycle();
                mVelocityTracker = null;
            }
        }

        if (mTouchMode == NONE) {
            mGestureDetector.onTouchEvent(event);
        }

        if (!mChart.isDragEnabled() && (!mChart.isScaleXEnabled() && !mChart.isScaleYEnabled()))
            return true;

        // Handle touch events here...
        switch (event.getAction() & MotionEvent.ACTION_MASK) {

            case MotionEvent.ACTION_DOWN:

                startAction(event);

                stopDeceleration();

                saveTouchStart(event);

                break;
            case MotionEvent.ACTION_POINTER_DOWN:

                if (event.getPointerCount() >= 2) {

                    mChart.disableScroll();

                    saveTouchStart(event);

                    // get the distance between the pointers on the x-axis
                    mSavedXDist = getXDist(event);

                    // get the distance between the pointers on the y-axis
                    mSavedYDist = getYDist(event);

                    // get the total distance between the pointers
                    mSavedDist = spacing(event);

                    if (mSavedDist > 10f) {

                        if (mChart.isPinchZoomEnabled()) {
                            mTouchMode = PINCH_ZOOM;
                        } else {
                            if (mSavedXDist > mSavedYDist)
                                mTouchMode = X_ZOOM;
                            else
                                mTouchMode = Y_ZOOM;
                        }
                    }

                    // determine the touch-pointer center
                    midPoint(mTouchPointCenter, event);
                }
                break;
            case MotionEvent.ACTION_MOVE:

                if (mTouchMode == DRAG) {

                    mChart.disableScroll();
                    performDrag(event);

                } else if (mTouchMode == X_ZOOM || mTouchMode == Y_ZOOM || mTouchMode == PINCH_ZOOM) {

                    mChart.disableScroll();

                    if (mChart.isScaleXEnabled() || mChart.isScaleYEnabled())
                        performZoom(event);

                } else if (mTouchMode == NONE
                        && Math.abs(distance(event.getX(), mTouchStartPoint.x, event.getY(),
                                mTouchStartPoint.y)) > 5f) {


                    if (mChart.hasNoDragOffset()) {

                        if (!mChart.isFullyZoomedOut() && mChart.isDragEnabled()) {
                            mTouchMode = DRAG;
                        } else {

                            mLastGesture = ChartGesture.DRAG;

                            if (mChart.isHighlightPerDragEnabled())
                                performHighlightDrag(event);
                        }

                    } else if (mChart.isDragEnabled()) {
                        mLastGesture = ChartGesture.DRAG;
                        mTouchMode = DRAG;
                    }
                }
                break;

            case MotionEvent.ACTION_UP:

                final VelocityTracker velocityTracker = mVelocityTracker;
                final int pointerId = event.getPointerId(0);
                velocityTracker.computeCurrentVelocity(1000, Utils.getMaximumFlingVelocity());
                final float velocityY = velocityTracker.getYVelocity(pointerId);
                final float velocityX = velocityTracker.getXVelocity(pointerId);

                if (Math.abs(velocityX) > Utils.getMinimumFlingVelocity() ||
                        Math.abs(velocityY) > Utils.getMinimumFlingVelocity()) {

                    if (mTouchMode == DRAG && mChart.isDragDecelerationEnabled()) {

                        stopDeceleration();

                        mDecelerationLastTime = AnimationUtils.currentAnimationTimeMillis();
                        mDecelerationCurrentPoint = new PointF(event.getX(), event.getY());
                        mDecelerationVelocity = new PointF(velocityX, velocityY);

                        Utils.postInvalidateOnAnimation(mChart); // This causes computeScroll to fire, recommended for this by Google
                    }
                }

                if (mTouchMode == X_ZOOM ||
                        mTouchMode == Y_ZOOM ||
                        mTouchMode == PINCH_ZOOM ||
                        mTouchMode == POST_ZOOM) {

                    // Range might have changed, which means that Y-axis labels
                    // could have changed in size, affecting Y-axis size.
                    // So we need to recalculate offsets.
                    mChart.calculateOffsets();
                    mChart.postInvalidate();
                }

                mTouchMode = NONE;
                mChart.enableScroll();

                if (mVelocityTracker != null) {
                    mVelocityTracker.recycle();
                    mVelocityTracker = null;
                }

                endAction(event);

                break;
            case MotionEvent.ACTION_POINTER_UP:
                Utils.velocityTrackerPointerUpCleanUpIfNecessary(event, mVelocityTracker);

                mTouchMode = POST_ZOOM;
                break;

            case MotionEvent.ACTION_CANCEL:

                mTouchMode = NONE;
                endAction(event);
                break;
        }

        // Perform the transformation, update the chart
        // if (needsRefresh())
        mMatrix = mChart.getViewPortHandler().refresh(mMatrix, mChart, true);

        return true; // indicate event was handled
    }
private void performZoom(MotionEvent event) {

        if (event.getPointerCount() >= 2) {

            OnChartGestureListener l = mChart.getOnChartGestureListener();

            // get the distance between the pointers of the touch
            // event
            float totalDist = spacing(event);

            if (totalDist > 10f) {

                // get the translation
                PointF t = getTrans(mTouchPointCenter.x, mTouchPointCenter.y);

                // take actions depending on the activated touch
                // mode
                if (mTouchMode == PINCH_ZOOM) {

                    mLastGesture = ChartGesture.PINCH_ZOOM;

                    float scale = totalDist / mSavedDist; // total scale

                    boolean isZoomingOut = (scale < 1);
                    boolean canZoomMoreX = isZoomingOut ?
                            mChart.getViewPortHandler().canZoomOutMoreX() :
                            mChart.getViewPortHandler().canZoomInMoreX();

                    float scaleX = (mChart.isScaleXEnabled()) ? scale : 1f;
                    float scaleY = (mChart.isScaleYEnabled()) ? scale : 1f;

                    if (mChart.isScaleYEnabled() || canZoomMoreX) {
                    	Log.v("performZoom", "PINCH_ZOOM :scaleX:"+scaleX+" scaleY "+scaleY);
                        mMatrix.set(mSavedMatrix);
                        mMatrix.postScale(scaleX, scaleY, t.x, t.y);
                        if (l != null){
                        	l.onChartScale(event, scaleX, scaleY);

                        }

                    }

                } else if (mTouchMode == X_ZOOM && mChart.isScaleXEnabled()) {

                    mLastGesture = ChartGesture.X_ZOOM;

                    float xDist = getXDist(event);
                    float scaleX = xDist / mSavedXDist; // x-axis scale

                    boolean isZoomingOut = (scaleX < 1);
                    boolean canZoomMoreX = isZoomingOut ?
                            mChart.getViewPortHandler().canZoomOutMoreX() :
                            mChart.getViewPortHandler().canZoomInMoreX();

                    if (canZoomMoreX) {

                        mMatrix.set(mSavedMatrix);
                        mMatrix.postScale(scaleX, 1f, t.x, t.y);
                        Log.v("performZoom", "scaleX:"+scaleX);
                        Log.v("performZoom", "l!=null:"+(l != null));
                        Log.v("performZoom", "isZoomingOut:"+isZoomingOut);
                        Log.v("performZoom", "canZoomMoreX:"+canZoomMoreX);
                        Log.v("performZoom", "class :"+this.getClass().getName());
                        if (l != null){
                        	l.onChartScale(event, scaleX, 1f);
                        	Log.v("performZoom", "onChartScale :scaleX:"+scaleX);
                        	Log.v("performZoom", "class ::"+this.getClass().getName());
                        }

                    }

                } else if (mTouchMode == Y_ZOOM && mChart.isScaleYEnabled()) {

                    mLastGesture = ChartGesture.Y_ZOOM;

                    float yDist = getYDist(event);
                    float scaleY = yDist / mSavedYDist; // y-axis scale

                    mMatrix.set(mSavedMatrix);

                    // y-axis comes from top to bottom, revert y
                    mMatrix.postScale(1f, scaleY, t.x, t.y);

                    if (l != null)
                        l.onChartScale(event, 1f, scaleY);
                }
            }
        }
}l.onChartScale(event, 1f, scaleY);虽然线索断了,但是也不能就此放弃,这个过程中我们知道了一个单词Zoom,咦,是不是有点熟悉,在BarChart的方法中好像有这些方法,嗯,没错:
/**
     * Zooms in by 1.4f, into the charts center. center.
     */
    public void zoomIn() {
        Matrix save = mViewPortHandler.zoomIn(getWidth() / 2f, -(getHeight() / 2f));
        mViewPortHandler.refresh(save, this, true);

        // Range might have changed, which means that Y-axis labels
        // could have changed in size, affecting Y-axis size.
        // So we need to recalculate offsets.
        calculateOffsets();
        postInvalidate();
    }

    /**
     * Zooms out by 0.7f, from the charts center. center.
     */
    public void zoomOut() {
        Matrix save = mViewPortHandler.zoomOut(getWidth() / 2f, -(getHeight() / 2f));
        mViewPortHandler.refresh(save, this, true);

        // Range might have changed, which means that Y-axis labels
        // could have changed in size, affecting Y-axis size.
        // So we need to recalculate offsets.
        calculateOffsets();
        postInvalidate();
    }

    /**
     * Zooms in or out by the given scale factor. x and y are the coordinates
     * (in pixels) of the zoom center.
     *
     * @param scaleX if < 1f --> zoom out, if > 1f --> zoom in
     * @param scaleY if < 1f --> zoom out, if > 1f --> zoom in
     * @param x
     * @param y
     */
    public void zoom(float scaleX, float scaleY, float x, float y) {
        Matrix save = mViewPortHandler.zoom(scaleX, scaleY, x, -y);
        mViewPortHandler.refresh(save, this, true);

        // Range might have changed, which means that Y-axis labels
        // could have changed in size, affecting Y-axis size.
        // So we need to recalculate offsets.
        calculateOffsets();
        postInvalidate();
    }
(虽然过程似乎超乎意料,但是结果像是也在情理之中,就这样把)
智能推荐
使用nginx解决浏览器跨域问题_nginx不停的xhr-程序员宅基地
文章浏览阅读1k次。通过使用ajax方法跨域请求是浏览器所不允许的,浏览器出于安全考虑是禁止的。警告信息如下:不过jQuery对跨域问题也有解决方案,使用jsonp的方式解决,方法如下:$.ajax({ async:false, url: 'http://www.mysite.com/demo.do', // 跨域URL ty..._nginx不停的xhr
在 Oracle 中配置 extproc 以访问 ST_Geometry-程序员宅基地
文章浏览阅读2k次。关于在 Oracle 中配置 extproc 以访问 ST_Geometry,也就是我们所说的 使用空间SQL 的方法,官方文档链接如下。http://desktop.arcgis.com/zh-cn/arcmap/latest/manage-data/gdbs-in-oracle/configure-oracle-extproc.htm其实简单总结一下,主要就分为以下几个步骤。..._extproc
Linux C++ gbk转为utf-8_linux c++ gbk->utf8-程序员宅基地
文章浏览阅读1.5w次。linux下没有上面的两个函数,需要使用函数 mbstowcs和wcstombsmbstowcs将多字节编码转换为宽字节编码wcstombs将宽字节编码转换为多字节编码这两个函数,转换过程中受到系统编码类型的影响,需要通过设置来设定转换前和转换后的编码类型。通过函数setlocale进行系统编码的设置。linux下输入命名locale -a查看系统支持的编码_linux c++ gbk->utf8
IMP-00009: 导出文件异常结束-程序员宅基地
文章浏览阅读750次。今天准备从生产库向测试库进行数据导入,结果在imp导入的时候遇到“ IMP-00009:导出文件异常结束” 错误,google一下,发现可能有如下原因导致imp的数据太大,没有写buffer和commit两个数据库字符集不同从低版本exp的dmp文件,向高版本imp导出的dmp文件出错传输dmp文件时,文件损坏解决办法:imp时指定..._imp-00009导出文件异常结束
python程序员需要深入掌握的技能_Python用数据说明程序员需要掌握的技能-程序员宅基地
文章浏览阅读143次。当下是一个大数据的时代,各个行业都离不开数据的支持。因此,网络爬虫就应运而生。网络爬虫当下最为火热的是Python,Python开发爬虫相对简单,而且功能库相当完善,力压众多开发语言。本次教程我们爬取前程无忧的招聘信息来分析Python程序员需要掌握那些编程技术。首先在谷歌浏览器打开前程无忧的首页,按F12打开浏览器的开发者工具。浏览器开发者工具是用于捕捉网站的请求信息,通过分析请求信息可以了解请..._初级python程序员能力要求
Spring @Service生成bean名称的规则(当类的名字是以两个或以上的大写字母开头的话,bean的名字会与类名保持一致)_@service beanname-程序员宅基地
文章浏览阅读7.6k次,点赞2次,收藏6次。@Service标注的bean,类名:ABDemoService查看源码后发现,原来是经过一个特殊处理:当类的名字是以两个或以上的大写字母开头的话,bean的名字会与类名保持一致public class AnnotationBeanNameGenerator implements BeanNameGenerator { private static final String C..._@service beanname
随便推点
二叉树的各种创建方法_二叉树的建立-程序员宅基地
文章浏览阅读6.9w次,点赞73次,收藏463次。1.前序创建#include<stdio.h>#include<string.h>#include<stdlib.h>#include<malloc.h>#include<iostream>#include<stack>#include<queue>using namespace std;typed_二叉树的建立
解决asp.net导出excel时中文文件名乱码_asp.net utf8 导出中文字符乱码-程序员宅基地
文章浏览阅读7.1k次。在Asp.net上使用Excel导出功能,如果文件名出现中文,便会以乱码视之。 解决方法: fileName = HttpUtility.UrlEncode(fileName, System.Text.Encoding.UTF8);_asp.net utf8 导出中文字符乱码
笔记-编译原理-实验一-词法分析器设计_对pl/0作以下修改扩充。增加单词-程序员宅基地
文章浏览阅读2.1k次,点赞4次,收藏23次。第一次实验 词法分析实验报告设计思想词法分析的主要任务是根据文法的词汇表以及对应约定的编码进行一定的识别,找出文件中所有的合法的单词,并给出一定的信息作为最后的结果,用于后续语法分析程序的使用;本实验针对 PL/0 语言 的文法、词汇表编写一个词法分析程序,对于每个单词根据词汇表输出: (单词种类, 单词的值) 二元对。词汇表:种别编码单词符号助记符0beginb..._对pl/0作以下修改扩充。增加单词
android adb shell 权限,android adb shell权限被拒绝-程序员宅基地
文章浏览阅读773次。我在使用adb.exe时遇到了麻烦.我想使用与bash相同的adb.exe shell提示符,所以我决定更改默认的bash二进制文件(当然二进制文件是交叉编译的,一切都很完美)更改bash二进制文件遵循以下顺序> adb remount> adb push bash / system / bin /> adb shell> cd / system / bin> chm..._adb shell mv 权限
投影仪-相机标定_相机-投影仪标定-程序员宅基地
文章浏览阅读6.8k次,点赞12次,收藏125次。1. 单目相机标定引言相机标定已经研究多年,标定的算法可以分为基于摄影测量的标定和自标定。其中,应用最为广泛的还是张正友标定法。这是一种简单灵活、高鲁棒性、低成本的相机标定算法。仅需要一台相机和一块平面标定板构建相机标定系统,在标定过程中,相机拍摄多个角度下(至少两个角度,推荐10~20个角度)的标定板图像(相机和标定板都可以移动),即可对相机的内外参数进行标定。下面介绍张氏标定法(以下也这么称呼)的原理。原理相机模型和单应矩阵相机标定,就是对相机的内外参数进行计算的过程,从而得到物体到图像的投影_相机-投影仪标定
Wayland架构、渲染、硬件支持-程序员宅基地
文章浏览阅读2.2k次。文章目录Wayland 架构Wayland 渲染Wayland的 硬件支持简 述: 翻译一篇关于和 wayland 有关的技术文章, 其英文标题为Wayland Architecture .Wayland 架构若是想要更好的理解 Wayland 架构及其与 X (X11 or X Window System) 结构;一种很好的方法是将事件从输入设备就开始跟踪, 查看期间所有的屏幕上出现的变化。这就是我们现在对 X 的理解。 内核是从一个输入设备中获取一个事件,并通过 evdev 输入_wayland