python - matplotlib.legend()函数用法解析_python legend函数-程序员宅基地
技术标签: python
1.图例legend基础语法及用法
legend语法参数如下: matplotlib.pyplot.legend(*args, **kwargs)
| Keyword |
Description |
| loc |
Location code string, or tuple (see below).图例所有figure位置 |
| prop |
the font property字体参数 |
| fontsize |
the font size (used only if prop is not specified) |
| markerscale |
the relative size of legend markers vs. original 图例标记与原始标记的相对大小 |
| markerfirst |
If True (default), marker is to left of the label. 如果为True,则图例标记位于图例标签的左侧 |
| numpoints |
the number of points in the legend for line 为线条图图例条目创建的标记点数 |
| scatterpoints |
the number of points in the legend for scatter plot 为散点图图例条目创建的标记点数 |
| scatteryoffsets |
a list of yoffsets for scatter symbols in legend 为散点图图例条目创建的标记的垂直偏移量 |
| frameon |
If True, draw the legend on a patch (frame). 控制是否应在图例周围绘制框架 |
| fancybox |
If True, draw the frame with a round fancybox. 控制是否应在构成图例背景的FancyBboxPatch周围启用圆边 |
| shadow |
If True, draw a shadow behind legend. 控制是否在图例后面画一个阴影 |
| framealpha |
Transparency of the frame. 控制图例框架的 Alpha 透明度 |
| edgecolor |
Frame edgecolor. |
| facecolor |
Frame facecolor. |
| ncol |
number of columns 设置图例分为n列展示 |
| borderpad |
the fractional whitespace inside the legend border 图例边框的内边距 |
| labelspacing |
the vertical space between the legend entries 图例条目之间的垂直间距 |
| handlelength |
the length of the legend handles 图例句柄的长度 |
| handleheight |
the height of the legend handles 图例句柄的高度 |
| handletextpad |
the pad between the legend handle and text 图例句柄和文本之间的间距 |
| borderaxespad |
the pad between the axes and legend border 轴与图例边框之间的距离 |
| columnspacing |
the spacing between columns 列间距 |
| title |
the legend title |
| bbox_to_anchor |
the bbox that the legend will be anchored.指定图例在轴的位置 |
| bbox_transform |
the transform for the bbox. transAxes if None. |
(1)设置图例位置
使用loc参数
plt.legend(loc='lower left')
| 0: ‘best' 1: ‘upper right' 2: ‘upper left' 3: ‘lower left' |
4: ‘lower right' 5: ‘right' 6: ‘center left' |
7: ‘center right' 8: ‘lower center' 9: ‘upper center' 10: ‘center' |
(2)设置图例字体
#设置字体大小
fontsize : int or float or {‘xx-small’, ‘x-small’, ‘small’, ‘medium’, ‘large’, ‘x-large’, ‘xx-large’}
(3)设置图例边框及背景
plt.legend(loc='best',frameon=False) #去掉图例边框
plt.legend(loc='best',edgecolor='blue') #设置图例边框颜色
plt.legend(loc='best',facecolor='blue') #设置图例背景颜色,若无边框,参数无效
(4)设置图例标题
plt.legend(loc='best',title='figure 1 legend') #去掉图例边框
2.legend面向对象命令
(1)获取并设置legend图例
plt.legend(loc=0, numpoints=1)
leg = plt.gca().get_legend() #或leg=ax.get_legend()
ltext = leg.get_texts()
plt.setp(ltext, fontsize=12,fontweight='bold')
(2)设置图例
legend = ax.legend((rectsTest1, rectsTest2, rectsTest3), ('test1', 'test2', 'test3'))
legend = ax.legend(loc='upper center', shadow=True, fontsize='x-large')
legend.get_frame().set_facecolor('red') #设置图例legend背景为红色
frame = legend.get_frame()
frame.set_alpha(1)
frame.set_facecolor('none') #设置图例legend背景透明
(3)移除图例
ax1.legend_.remove() ##移除子图ax1中的图例
ax2.legend_.remove() ##移除子图ax2中的图例
ax3.legend_.remove() ##移除子图ax3中的图例
3.案例:设置图例legend到图形边界外
-
#主要是bbox_to_anchor的使用 -
box = ax1.get_position() -
ax1.set_position([box.x0, box.y0, box.width , box.height* 0.8]) -
ax1.legend(loc='center', bbox_to_anchor=(0.5, 1.2),ncol=3)
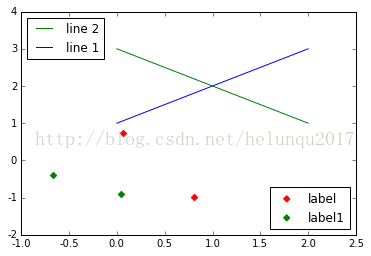
4.案例:显示多图例legend
-
import matplotlib.pyplot as plt -
import numpy as np -
x = np.random.uniform(-1, 1, 4) -
y = np.random.uniform(-1, 1, 4) -
p1, = plt.plot([1,2,3]) -
p2, = plt.plot([3,2,1]) -
l1 = plt.legend([p2, p1], ["line 2", "line 1"], loc='upper left') -
p3 = plt.scatter(x[0:2], y[0:2], marker = 'D', color='r') -
p4 = plt.scatter(x[2:], y[2:], marker = 'D', color='g') -
# This removes l1 from the axes. -
plt.legend([p3, p4], ['label', 'label1'], loc='lower right', scatterpoints=1) -
# Add l1 as a separate artist to the axes -
plt.gca().add_artist(l1)
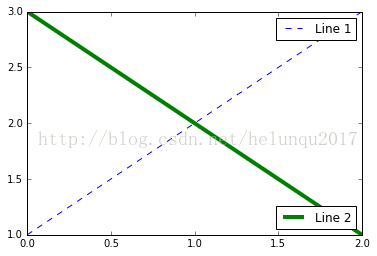
-
import matplotlib.pyplot as plt -
line1, = plt.plot([1,2,3], label="Line 1", linestyle='--') -
line2, = plt.plot([3,2,1], label="Line 2", linewidth=4) -
# 为第一个线条创建图例 -
first_legend = plt.legend(handles=[line1], loc=1) -
# 手动将图例添加到当前轴域 -
ax = plt.gca().add_artist(first_legend) -
# 为第二个线条创建另一个图例 -
plt.legend(handles=[line2], loc=4) -
plt.show()
智能推荐
Docker 快速上手学习入门教程_docker菜鸟教程-程序员宅基地
文章浏览阅读2.5w次,点赞6次,收藏50次。官方解释是,docker 容器是机器上的沙盒进程,它与主机上的所有其他进程隔离。所以容器只是操作系统中被隔离开来的一个进程,所谓的容器化,其实也只是对操作系统进行欺骗的一种语法糖。_docker菜鸟教程
电脑技巧:Windows系统原版纯净软件必备的两个网站_msdn我告诉你-程序员宅基地
文章浏览阅读5.7k次,点赞3次,收藏14次。该如何避免的,今天小编给大家推荐两个下载Windows系统官方软件的资源网站,可以杜绝软件捆绑等行为。该站提供了丰富的Windows官方技术资源,比较重要的有MSDN技术资源文档库、官方工具和资源、应用程序、开发人员工具(Visual Studio 、SQLServer等等)、系统镜像、设计人员工具等。总的来说,这两个都是非常优秀的Windows系统镜像资源站,提供了丰富的Windows系统镜像资源,并且保证了资源的纯净和安全性,有需要的朋友可以去了解一下。这个非常实用的资源网站的创建者是国内的一个网友。_msdn我告诉你
vue2封装对话框el-dialog组件_<el-dialog 封装成组件 vue2-程序员宅基地
文章浏览阅读1.2k次。vue2封装对话框el-dialog组件_
MFC 文本框换行_c++ mfc同一框内输入二行怎么换行-程序员宅基地
文章浏览阅读4.7k次,点赞5次,收藏6次。MFC 文本框换行 标签: it mfc 文本框1.将Multiline属性设置为True2.换行是使用"\r\n" (宽字符串为L"\r\n")3.如果需要编辑并且按Enter键换行,还要将 Want Return 设置为 True4.如果需要垂直滚动条的话将Vertical Scroll属性设置为True,需要水平滚动条的话将Horizontal Scroll属性设_c++ mfc同一框内输入二行怎么换行
redis-desktop-manager无法连接redis-server的解决方法_redis-server doesn't support auth command or ismis-程序员宅基地
文章浏览阅读832次。检查Linux是否是否开启所需端口,默认为6379,若未打开,将其开启:以root用户执行iptables -I INPUT -p tcp --dport 6379 -j ACCEPT如果还是未能解决,修改redis.conf,修改主机地址:bind 192.168.85.**;然后使用该配置文件,重新启动Redis服务./redis-server redis.conf..._redis-server doesn't support auth command or ismisconfigured. try
实验四 数据选择器及其应用-程序员宅基地
文章浏览阅读4.9k次。济大数电实验报告_数据选择器及其应用
随便推点
灰色预测模型matlab_MATLAB实战|基于灰色预测河南省社会消费品零售总额预测-程序员宅基地
文章浏览阅读236次。1研究内容消费在生产中占据十分重要的地位,是生产的最终目的和动力,是保持省内经济稳定快速发展的核心要素。预测河南省社会消费品零售总额,是进行宏观经济调控和消费体制改变创新的基础,是河南省内人民对美好的全面和谐社会的追求的要求,保持河南省经济稳定和可持续发展具有重要意义。本文建立灰色预测模型,利用MATLAB软件,预测出2019年~2023年河南省社会消费品零售总额预测值分别为21881...._灰色预测模型用什么软件
log4qt-程序员宅基地
文章浏览阅读1.2k次。12.4-在Qt中使用Log4Qt输出Log文件,看这一篇就足够了一、为啥要使用第三方Log库,而不用平台自带的Log库二、Log4j系列库的功能介绍与基本概念三、Log4Qt库的基本介绍四、将Log4qt组装成为一个单独模块五、使用配置文件的方式配置Log4Qt六、使用代码的方式配置Log4Qt七、在Qt工程中引入Log4Qt库模块的方法八、获取示例中的源代码一、为啥要使用第三方Log库,而不用平台自带的Log库首先要说明的是,在平时开发和调试中开发平台自带的“打印输出”已经足够了。但_log4qt
100种思维模型之全局观思维模型-67_计算机中对于全局观的-程序员宅基地
文章浏览阅读786次。全局观思维模型,一个教我们由点到线,由线到面,再由面到体,不断的放大格局去思考问题的思维模型。_计算机中对于全局观的
线程间控制之CountDownLatch和CyclicBarrier使用介绍_countdownluach于cyclicbarrier的用法-程序员宅基地
文章浏览阅读330次。一、CountDownLatch介绍CountDownLatch采用减法计算;是一个同步辅助工具类和CyclicBarrier类功能类似,允许一个或多个线程等待,直到在其他线程中执行的一组操作完成。二、CountDownLatch俩种应用场景: 场景一:所有线程在等待开始信号(startSignal.await()),主流程发出开始信号通知,既执行startSignal.countDown()方法后;所有线程才开始执行;每个线程执行完发出做完信号,既执行do..._countdownluach于cyclicbarrier的用法
自动化监控系统Prometheus&Grafana_-自动化监控系统prometheus&grafana实战-程序员宅基地
文章浏览阅读508次。Prometheus 算是一个全能型选手,原生支持容器监控,当然监控传统应用也不是吃干饭的,所以就是容器和非容器他都支持,所有的监控系统都具备这个流程,_-自动化监控系统prometheus&grafana实战
React 组件封装之 Search 搜索_react search-程序员宅基地
文章浏览阅读4.7k次。输入关键字,可以通过键盘的搜索按钮完成搜索功能。_react search